Why Traditional Strategy Processes Often Fail
In many companies, strategy development follows a familiar pattern: A small team of executives or consultants creates a strategy, which is then presented in a series of PowerPoint slides. This is followed by an implementation phase, where employees are expected to simply “understand” the strategy and integrate it into their daily work.
However, this is precisely where the problem lies: Strategies often remain abstract and difficult to grasp.
A major obstacle is that words alone are often insufficient to make the complex interconnections of a corporate strategy understandable. Implementation frequently fails due to misunderstandings, lack of clarity, and a missing link between strategic goals and actual work processes.
Moreover, strategy and execution are inseparably linked. A strategy may be visionary and well-thought-out, but if it is not successfully executed, it remains ineffective. Yet, many leaders tend to blame a failed strategy on poor execution by employees instead of questioning whether the strategy itself was formulated in a way that is practical and easy to implement.
Business consultant Nilofer Merchant describes this phenomenon in her book “The New How” as the “Air Sandwich”:
- At the top of the organization, there is a clear vision and direction.
- At the operational level, there are specific work instructions for daily tasks.
- But in between, a large gap exists – the connection between strategic goals and actual execution is missing.
This disconnect causes many corporate strategies to be either misunderstood or never translated into action. Instead of addressing this structural challenge, management often takes little responsibility for the failure of a strategy. The blame is frequently placed on “poor execution” or “resistance within the organization”, rather than recognizing that a strategy can only be successful if it is designed with implementation in mind from the very beginning.
But there is a solution: Strategies must be visualized.
Why Strategy Visualization Works
Humans are inherently visual thinkers. Complex information is more easily understood when presented in the form of diagrams, maps, or graphics. While lengthy strategy documents and PowerPoint presentations often remain abstract, visual models make strategy tangible and actionable.
Strategy development is not an isolated process confined to the leadership team – it is an inclusive effort. The most effective strategies are not devised behind closed doors but emerge from an open, collaborative process that incorporates diverse perspectives. Visual models and diagrams play a crucial role in this, not only by providing clarity but also by offering entry points for broad participation across the organization. They help teams build a shared understanding, discuss strategic priorities, and explore different scenarios.
The following types of visual frameworks are particularly effective in making strategies more comprehensible and actionable:
- Strategy Map – Provides a one-page overview of the entire corporate strategy
- Strategy Canvas – Compares a company to its competitors and identifies differentiation opportunities
- Business Model Canvas – Clearly structures and visualizes business models
- Value Proposition Canvas – Helps companies refine and validate their value proposition based on customer needs
These frameworks are inspired by the book Mapping Experiences by James Kalbach.
Beyond these tools, there are numerous communication patterns that organizations can leverage to enhance strategy and collaboration. A more extensive collection of these patterns can be found in Communication Patterns by Jacqui Read.
The following sections will explore these visualization methods in detail, demonstrating how they help organizations make strategies more tangible, foster more effective collaboration, and establish a clearer connection between vision and execution.
The Most Essential Tools for Strategy Visualization
Translating strategy from theory into practice requires more than just words and abstract concepts. A strategy only becomes effective when it is tangible, understandable, and actionable. Visual methods provide a proven way to structure complex relationships and make them more accessible.
Particularly useful are diagrams that not only represent abstract strategies but also facilitate their implementation. These visual tools help teams align on common goals, identify challenges early, and enhance collaboration across different departments.
The following four powerful visualization methods help businesses clearly define, effectively communicate, and successfully implement their strategies:
1. Strategy Map: Understanding Strategy at a Glance
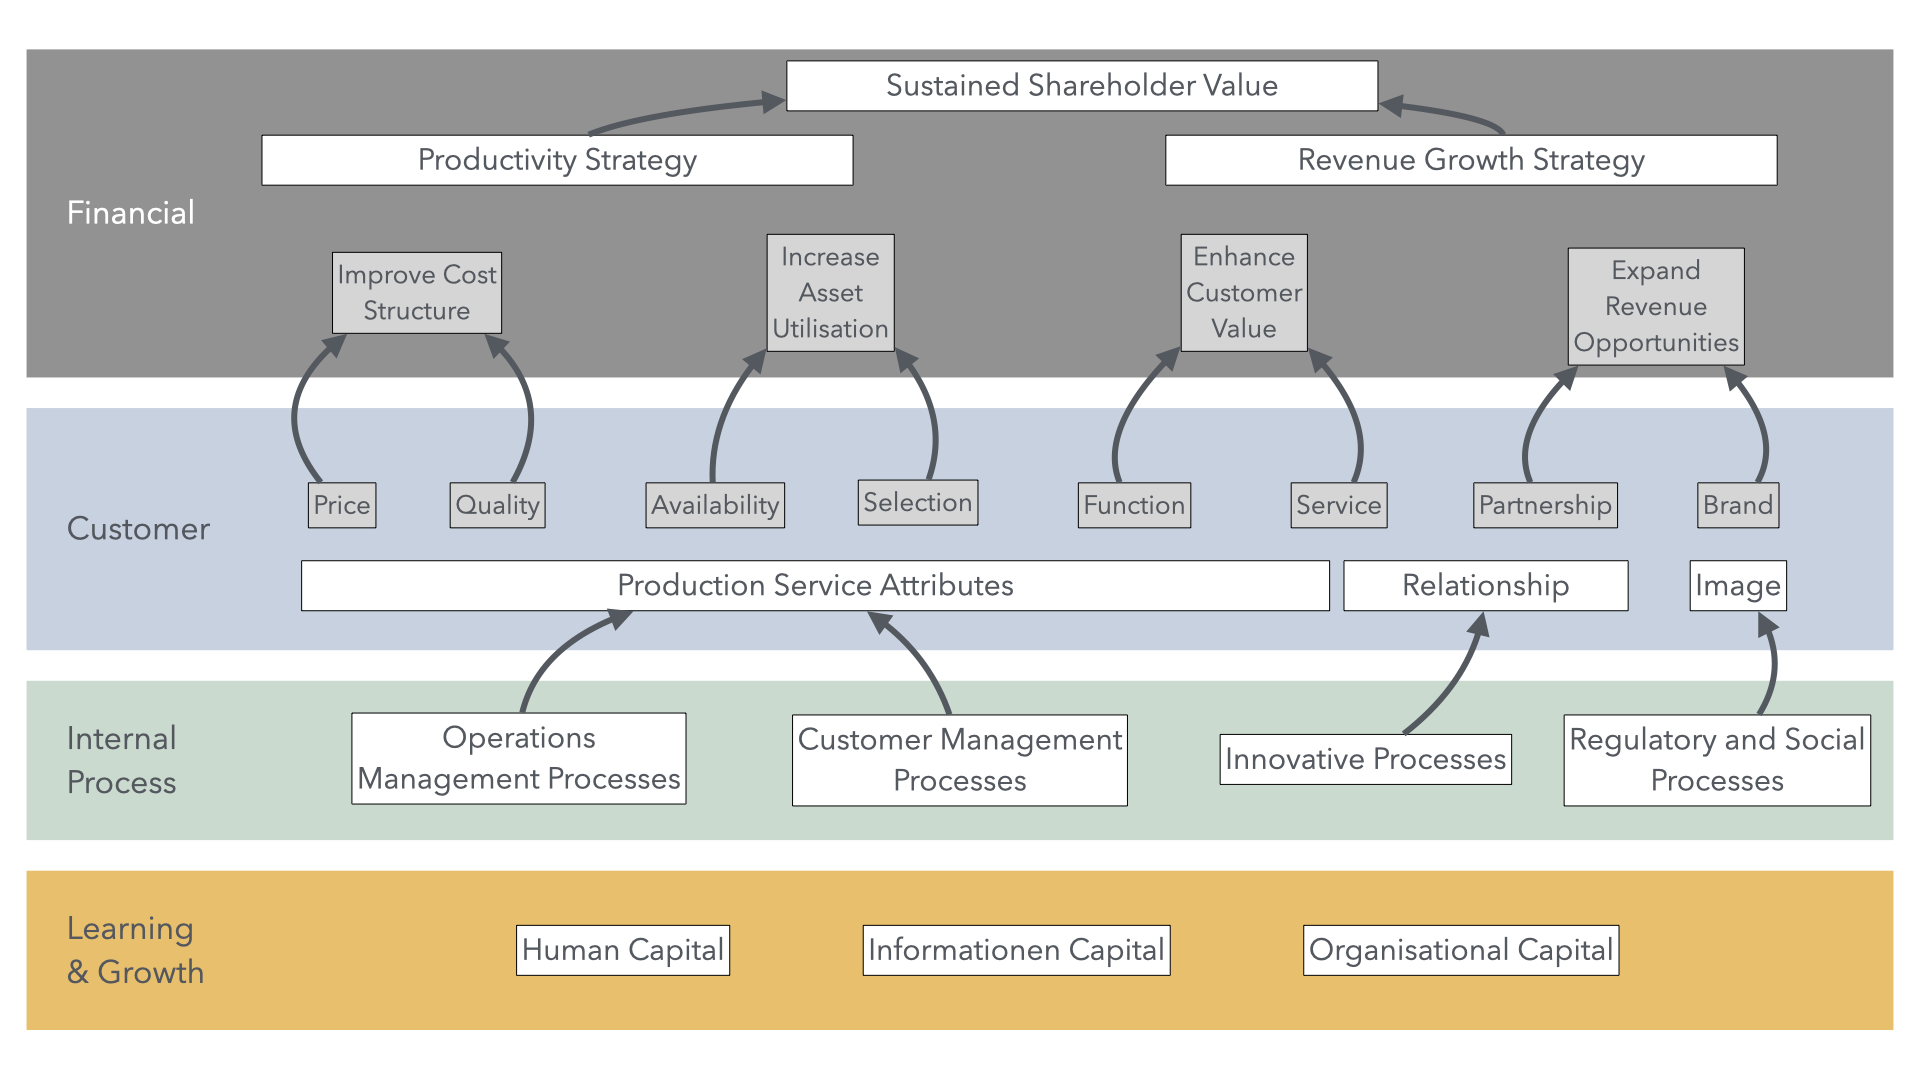 A Strategy Map provides a comprehensive view of a company’s strategy by visually representing its key objectives and their interconnections in a clear, structured format.
The map is divided into four perspectives that are interconnected, making the logic behind strategic direction visible:
Financial Perspective: Businesses must be financially successful to ensure long-term sustainability. This perspective defines revenue sources, cost structures, and financial goals. Examples include revenue growth, cost efficiency, and profitability improvement.
Customer Perspective: Financial success depends directly on the value created for customers. This section describes how the company wins over its customers, what needs it fulfills, and what benefits it provides. Key factors include customer satisfaction, product quality, service excellence, and brand image.
Internal Processes: To effectively deliver customer value, internal processes must be optimized. This includes all critical business operations needed to execute the strategy successfully, from product development and supply chain management to sales and customer service.
Learning & Growth: Long-term competitiveness requires continuous improvement. This perspective highlights the resources, competencies, technologies, and corporate culture needed to sustain the business strategy. Key elements include employee training, digital transformation, research & development, and knowledge management.
Strategy Maps help companies visualize the link between strategic objectives and operational actions, providing a shared direction for all employees.
By making causal relationships between goals visible, businesses can understand how one action influences another. For instance, investing in sustainable materials enhances brand perception, leading to increased customer loyalty and ultimately higher revenues.
A great example of a well-executed Strategy Map is Patagonia, which has aligned its entire business strategy with sustainability.
2. Strategy Canvas: Redefining Competition:
The Strategy Canvas is a key tool from the Blue Ocean Strategy framework by W. Chan Kim and Renée Mauborgne. It compares a company to its competitors along various success factors and helps identify new opportunities for differentiation.
The horizontal axis represents the key factors that drive competitiveness in an industry—such as price, service quality, product features, or distribution channels.
The vertical axis indicates how strongly a company performs in each of these areas compared to its competitors.
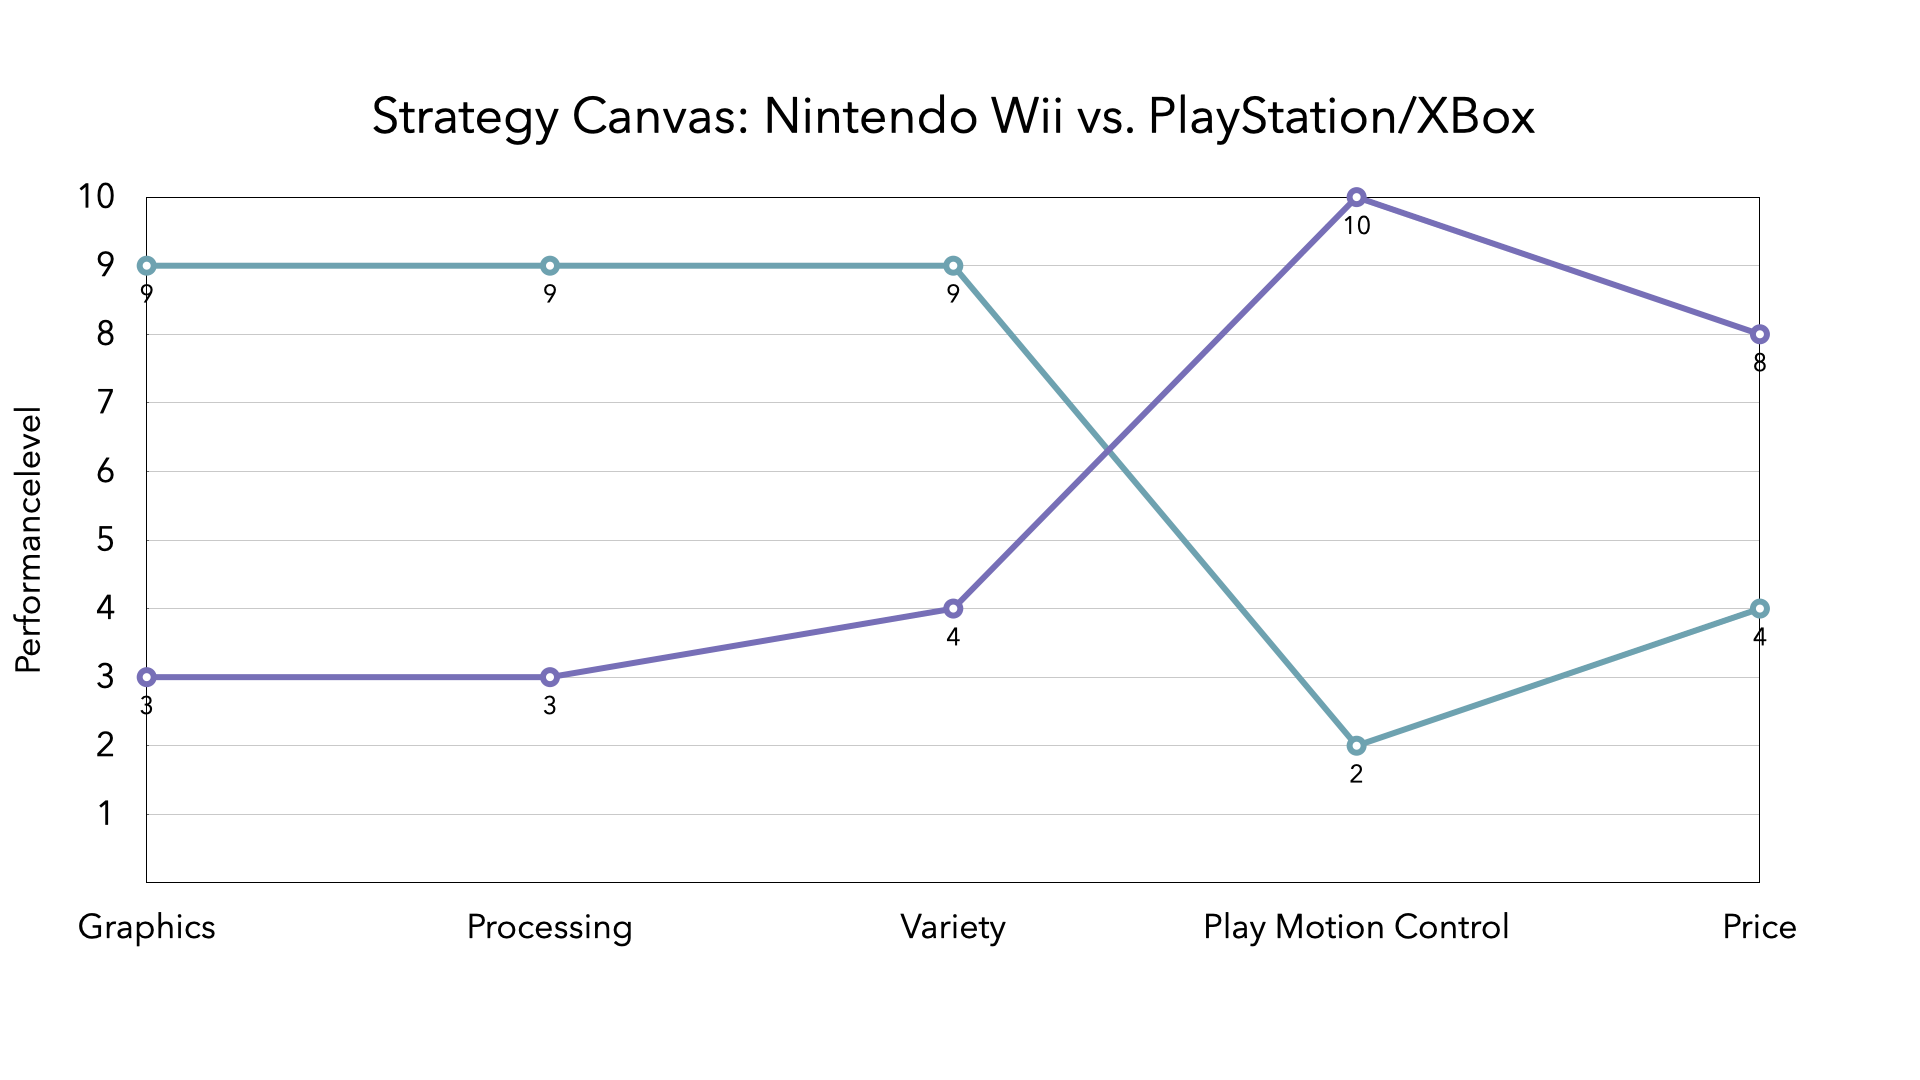
A great example of a successful Strategy Canvas is Nintendo’s Wii console. Instead of competing with Sony (PlayStation) and Microsoft (Xbox) on hardware performance and high-end graphics, Nintendo pursued a completely different strategy:
Instead of expensive high-performance hardware, Nintendo focused on an affordable console with innovative motion controls.
Instead of targeting hardcore gamers who prioritize graphics-heavy experiences, Nintendo expanded its audience to include families and casual gamers.
Instead of competing head-to-head with PlayStation and Xbox, Nintendo created a new gaming experience centered around physical movement, opening up entirely new customer segments.
By doing this, Nintendo eliminated traditional competitive factors like high-end graphics and processing power and instead emphasized usability, social interaction, and family-friendly gaming.
The Strategy Canvas enabled Nintendo to create an entirely new market instead of battling Sony and Microsoft in direct competition.
How to Create a Strategy Canvas?
To use a Strategy Canvas effectively, it should be developed systematically. The process consists of the following steps:
Identify the Key Value Factors:
- Every industry has a wide range of success factors. The goal is to identify the ones that are truly critical to market success.
- Alignment diagrams can help make these factors visible. They highlight the problems the company addresses and how value is perceived from the customer’s perspective.
Define Relevant Competitors:
- A Strategy Canvas should focus on a limited number of competitors to ensure that differentiation remains clear and actionable.
- Three competitors are ideal, as including too many comparison points can make the diagram overly complex and difficult to interpret.
Assess Competitor Performance for Each Factor:
- The evaluation is typically done on a relative scale from low to high.
- Alternatively, a data-driven analysis can be conducted based on customer surveys, market research, or sales performance data.
An alternative approach to identifying key competitive factors is to analyze the Customer Journey:
A Customer Journey Map outlines different interaction phases (e.g., purchase decision, usage, customer retention).
For each phase, businesses can evaluate how competing products or services perform.
The experience-based approach to competition can reveal new differentiation opportunities that might otherwise be overlooked.
Why Is the Strategy Canvas Valuable?
The Strategy Canvas is not just a tool for analyzing existing markets – it is also instrumental in developing new strategic positioning.
It helps companies eliminate unnecessary competitive factors and focus on elements that genuinely create value for customers.
It enables innovation that arises not from competitive pressure but from unexploited market potential.
It reduces strategic shortsightedness by offering a clear, visual representation of a company’s value proposition compared to its competition.
For Nintendo, applying this approach led to the Wii becoming one of the best-selling gaming consoles of all time – not by offering better hardware, but by creating an entirely new market positioning.
By using a Strategy Canvas, companies can critically assess their market position, simulate different strategic scenarios, and make data-driven decisions to drive growth and differentiation.
3. Strategy Blueprint: Structuring Strategy Development
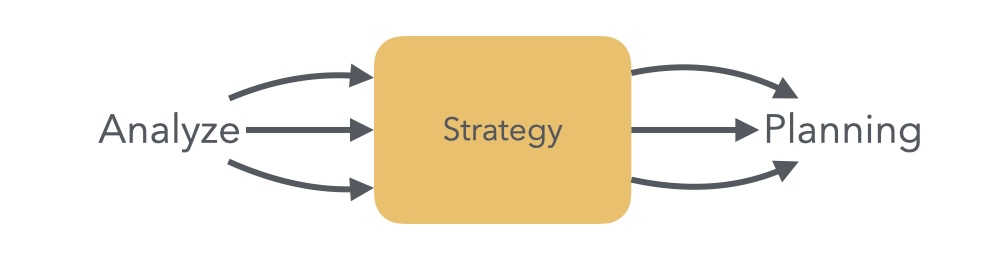 There is significant misunderstanding about what strategy truly is. It is often confused with analysis, which focuses on market size, financial forecasts, or technical assessments. Similarly, strategy is sometimes mistaken for planning, which manifests in the form of detailed roadmaps and financial targets. However, a strategy is not just an analysis or a static plan – it is the overarching logic that connects these elements.
A Strategy Blueprint helps companies visualize this logic. It illustrates the relationships between various strategic elements, allowing businesses to capture their core strategy on a single pag.
The Six Key Elements of a Strategy Blueprint A Strategy Blueprint is based on several proven frameworks, including Henry Mintzberg’s “Five Ps of Strategy” and Roger Martin’s “Five Strategy Questions”. From these, six fundamental components emerge:
- Challenges: Where does the company want to go? What obstacles and risks could stand in the way?
- Objectives: What long-term vision drives the strategy? What value does the company aim to create for its customers?
- Focus Areas: Where should the company concentrate its efforts? Which markets or product categories will it prioritize?
- Guiding Principles: What core values and beliefs should inform decision-making?
- Actions: What skills, capabilities, and initiatives are necessary to execute the strategy?
- Outcomes: How will progress and success be measured?
Strategy Blueprint is a valuable tool that helps companies clearly define their strategic logic while maintaining the flexibility to adapt to new challenges and opportunities.
4. Business Model Canvas: Structuring Business Models Clearly
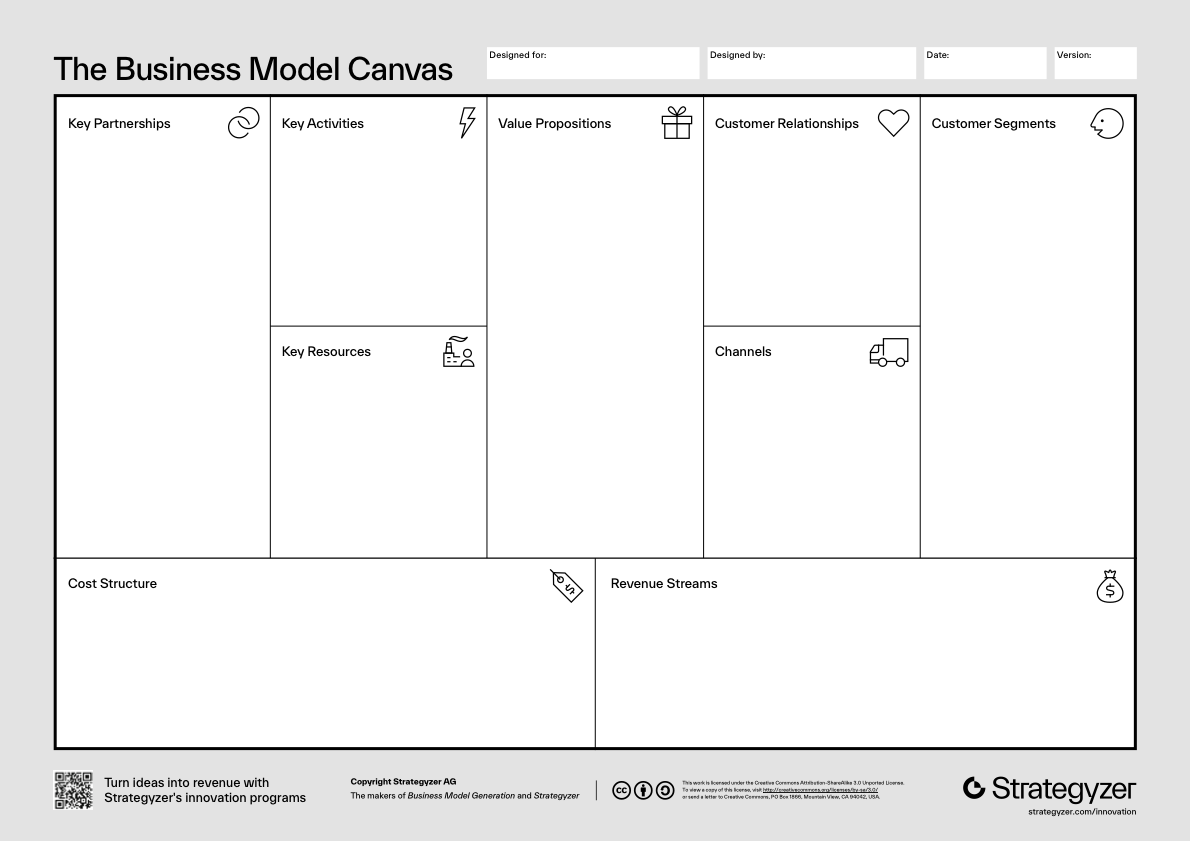
The Business Model Canvas developed by Alexander Osterwalder, is one of the most widely used tools for designing, analyzing, and innovating business models. It provides a structured, visual framework that helps companies define and communicate how they create, deliver, and capture value.
Instead of long business plans, the Business Model Canvas condenses the key elements of a business onto a single page, making it easy to iterate, test, and adapt strategies quickly.
The nine building blocks of the Business Model Canvas cover the core aspects of how a business operates:
1. Customer Segments – Who are our key customers?
A company exists to serve specific customer groups. Understanding these segments allows businesses to tailor their value proposition effectively.
- Are we targeting mass markets or niche markets?
- What are the different customer segments with unique needs?
- How do we prioritize and differentiate our approach for each segment?
2. Value Propositions – What value do we offer?
This is the core of a business model – it defines why customers should choose our product or service over alternatives.
- What problems do we solve for customers?
- What needs do we fulfill?
- Do we compete on cost, convenience, innovation, customization, or brand reputation?
3. Channels – How do we deliver our value proposition?
Companies must decide how they reach their customers effectively. Channels can be direct (e.g., own stores, e-commerce) or indirect (e.g., distributors, retail partners).
- How do customers prefer to interact with us?
- Which channels are most effective in terms of cost and reach?
- Do we leverage digital platforms, physical locations, or a mix?
4. Customer Relationships – How do we interact with customers?
Successful companies cultivate strong customer relationships to drive loyalty, retention, and advocacy. These relationships can range from automated self-service to highly personalized support.
- Do we focus on customer support, self-service, communities, or long-term engagement?
- How much personalization do we offer?
- How do we maintain relationships post-sale?
5. Revenue Streams – How do we generate revenue?
Businesses need a sustainable revenue model to survive. Revenue can come from:
- Transactional sales (one-time purchases)
- Subscription models (recurring revenue)
- Freemium models (free basic service, paid premium features)
- Advertising, licensing, or brokerage fees
6. Key Resources – What assets are essential to our business?
A business needs specific resources to operate, differentiate, and deliver its value proposition. These can be:
- Physical (factories, stores, distribution networks)
- Intellectual (brands, patents, proprietary software)
- Human (expertise, talent, partnerships)
- Financial (funding, investment capital)
7. Key Activities – What must we do to succeed?
These are the critical processes that drive a business forward:
- Product development – R&D, innovation, design
- Operations – Manufacturing, supply chain, logistics
- Marketing & sales – Brand positioning, outreach, customer acquisition
8. Key Partnerships – Who helps us create value?
Strategic partnerships can enhance efficiency, expand market reach, and provide resources. These may include:
- Suppliers and manufacturers
- Technology alliances
- Joint ventures and distributors
9. Cost Structure – What are our major expenses?
Understanding costs is crucial for financial planning. Companies need to determine whether they operate as:
- Cost-driven (minimizing costs, offering competitive pricing)
- Value-driven (premium services, high margins)
Common costs include R&D, marketing, labor, logistics, and operational expenses.
Why Is the Business Model Canvas So Powerful?
It provides a one-page overview of a company’s entire business model. It fosters innovation by enabling businesses to test different strategies rapidly. It helps startups, entrepreneurs, and established firms pivot, expand, or refine their operations. By using the Business Model Canvas, companies can better identify opportunities, optimize processes, and build sustainable, scalable business models.
5. Value Proposition Canvas: Structuring Value Propositions Effectively
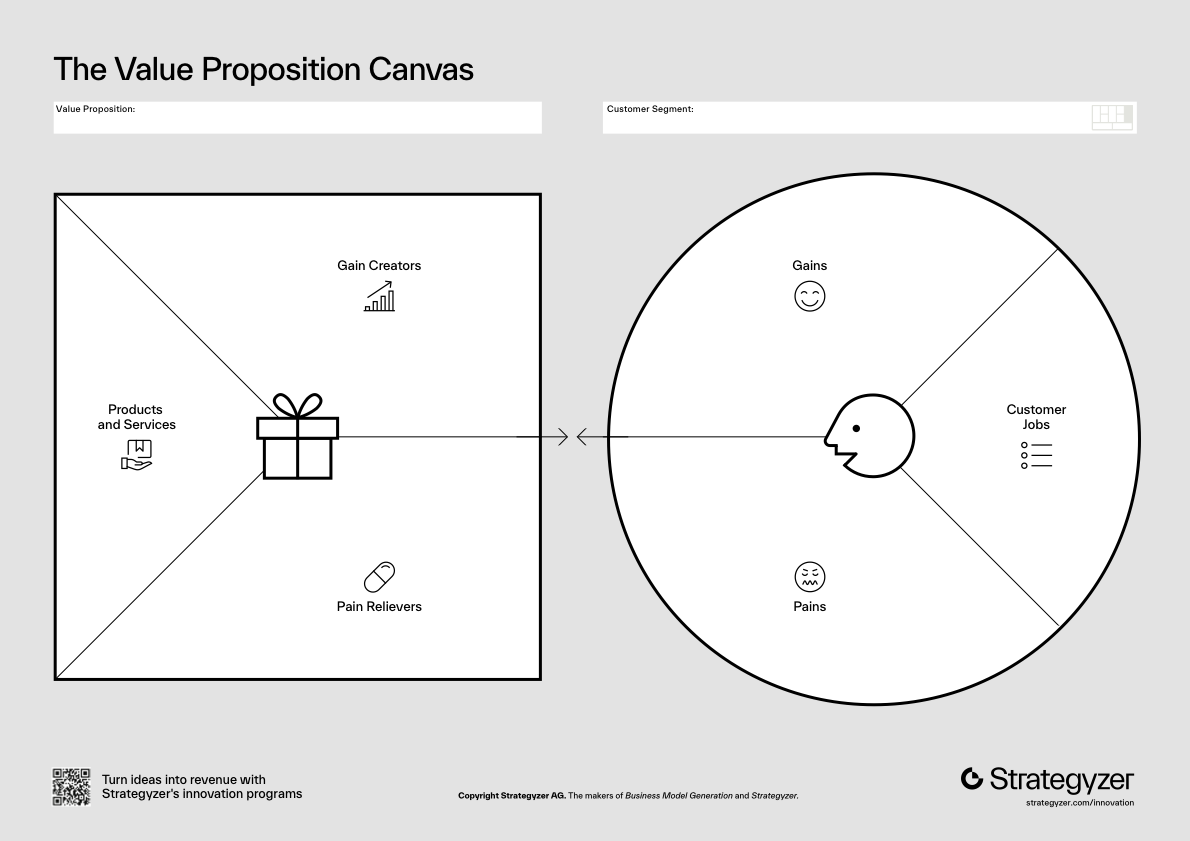 The Value Proposition Canvas is an extension of the Business Model Canvas, also developed by Alexander Osterwalder. It helps companies assess and refine their value proposition by ensuring it aligns with real customer needs.
The model consists of two key components:
Customer Profile: This section examines customer expectations, challenges, and needs:
- Jobs-to-be-Done: What tasks do customers want to accomplish? What problems are they trying to solve?
- Pains: What difficulties, risks, or frustrations do customers experience in achieving their goals?
- Gains: What positive outcomes or benefits do customers expect?
Value Proposition: This section analyzes how a company’s product or service meets customer needs:
- Products & Services: What specific offerings does the company provide?
- Pain Relievers: How does the product help reduce or eliminate customer problems?
- Gain Creators: What additional benefits or positive experiences does the product deliver?
Why Is the Value Proposition Canvas So Valuable The Value Proposition Canvas helps businesses focus on genuine customer needs rather than making assumptions about the market. It enables a structured, systematic approach to refining and validating value propositions, ensuring they are aligned with customer expectations and market demands.
Additionally, the Value Proposition Canvas fosters innovation by shifting the focus to the customer experience. It is particularly useful for startups, product developers, and innovation teams, ensuring that new products effectively address customer pain points and deliver meaningful advantages.
Conclusion: Visual Strategy Development as the Key to Success
Even the best strategies remain ineffective if they are not clearly formulated, structured, and systematically implemented. Visual methods such as:
- Strategy Map – A clear and cohesive representation of corporate strategy.
- Strategy Canvas – A comparative tool to identify differentiation opportunities among competitors.
- Business Model Canvas – A structured framework for analyzing business logic.
- Strategy Blueprint – A planning tool that interconnects key strategy elements.
- Value Proposition Canvas – A model for refining and optimizing the value proposition from the customer’s perspective.
… help companies make their strategies more tangible, understandable, and actionable.
Companies that incorporate visual strategy development benefit from:
- Greater clarity and comprehensibility
- Improved team communication
- Increased innovation potential through new perspectives
- More effective execution of strategic goals
Strategy is not a static concept – it must remain dynamic, evolve continuously, and, above all, be easily understood. Visual representation is the key to transforming strategy from theory into practice.